We are excited to announce the introduction of two indexes associated with ongoing disruption in the automotive industry: our Electric Vehicles (EVs) Index and Autonomous Vehicles (AVs) Index.
To create these indexes, we utilize predictions of hundreds of forecasters (the crowd), who participate in a forecasting tournament to paint a picture of how “bullish” or “bearish” is the disruptive trend with respect to electric and autonomous vehicles. The predictions relate to a range of disruption drivers around technological advancements, regulatory policies, and customer demand.
Each disruption index ranges from +100, indicating the forecasters’ collective “bullish” view, and -100, indicating their collective “bearish” view on the different disruption drivers. We calculate each index on a monthly basis, starting in March 2019. Please refer to our Disruption Index Methodology document (PDF) for an in-depth look at our methodology.
Below are the graphs of the historical trends of the two indexes. We walk through the sources of the shifts we see over time in turn.
EV Disruption Index
+29.11 (Bullish) as of Oct 14, 2019
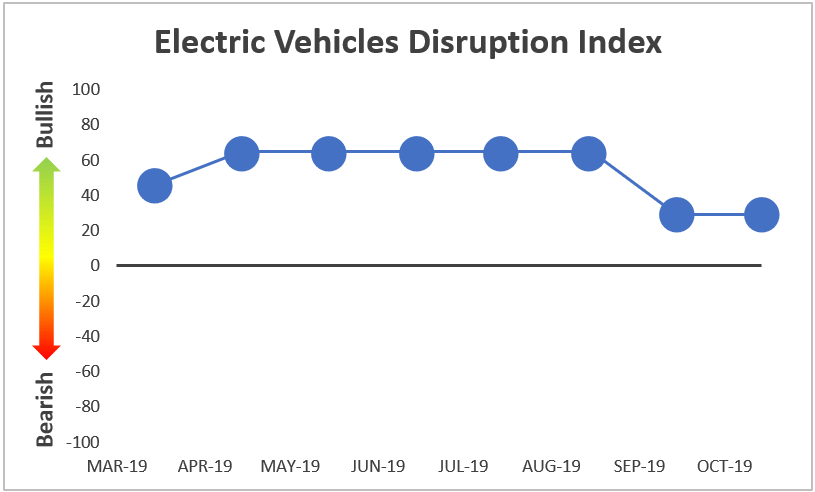
In March 2019, the Electric Vehicles (EV) Index began as bullish at +46.91 because the crowd projected that (1) Tesla Model 3 production through the end of 2019 was going to be relatively strong, (2) the average industry battery costs at the end of 2019 would be relatively low, (3) new energy vehicle sales in China during 2019 would be relatively high, and (4) there was a good chance that a 420+ mile range electric vehicle would be announced by the end of 2019. This was offset by the crowd’s bearish view that the U.S. would probably not eliminate the unit limit per manufacturer for U.S. federal EV tax credits by the end of 2019. Also, the crowd was neutral regarding the number of fast chargers that would be installed in the European area during 2019.
In April 2019, the EV Index jumped up to +64.55 as the crowd shifted their projections from neutral to bullish regarding the number of fast chargers that would be installed in the European area during 2019 because the crowd noted abnormally large increases in installations in March 2019. In September 2019, the index dropped to +29.11 as the crowd shifted their projections from bullish to bearish regarding the number of new energy vehicle (NEV) sales in China during 2019. This was driven by two months of negative year over year growth in NEV sales in China. The crowd did not make any major shifts in their projections regarding electric vehicles in October 2019.
EV Disruption Index
-0.57 (Bearish) as of Jun 12, 2019
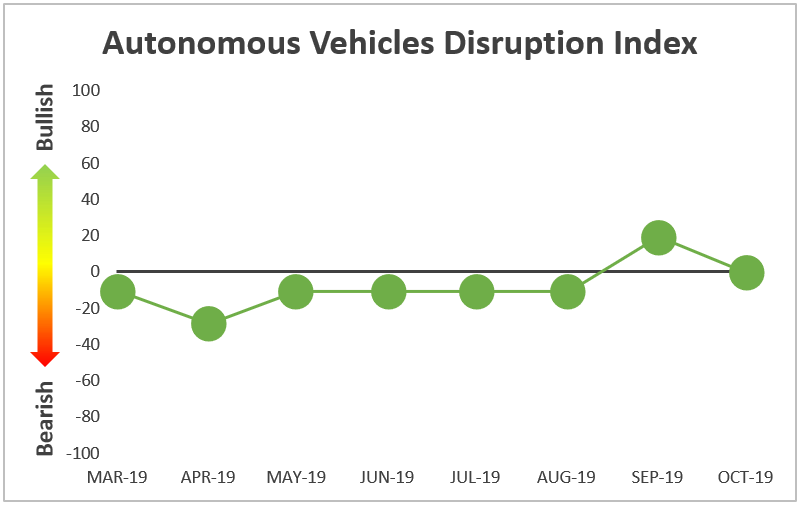
In March 2019, the Autonomous Vehicles (AV) Index began as bearish at -10.91 because the crowd projected that (1) the increase in the number of exemptions for autonomous vehicles allowed per manufacturer by the end of 2019 was less than likely, (2) General Motors launching an AV ride-hailing service open to the public in the U.S. by the end of 2019 was less than likely, (3) Tesla releasing an Autopilot feature designed to navigate traffic lights by the end of 2019 was less than likely, and (4) one or more fatal accidents involving a self-driving vehicle operating in autonomous mode in the U.S. before the end of 2019 was more than likely. This was offset by the crowd’s Bullish projections that (1) there would not be an unusually high number of AV-related accidents reported in California during 2019, (2) two or more cellular carriers offering 5G smartphones to US customers by July 2019 was more than likely, and (3) Velodyne, a leading LiDAR manufacturer, would announce the release of a LiDAR unit with a maximum range of 400+ meters, a considerable advancement in the technology.
In April 2019, the AV Index dropped to -28.51 as the crowd shifted their projections from bullish to bearish regarding whether two or more cellular carriers offering 5G smartphones to US customers by July 2019. This was driven by general concerns that anyone beyond Verizon would be able to make it by our deadline. In May 2019, the AV Index returned to -10.91 as the crowd shifted their projections back from bearish to bullish regarding this same question because news broke was that T-Mobile became likely to join Verizon before the our deadline. In September 2019, the AV Index jumped to +18.81 as the crowd shifted their projections from bearish to bullish regarding whether one or more fatal accidents involving a self-driving vehicle operating in autonomous mode in the U.S. would occur before the end of 2019. This was driven by the fact that many forecasters wanted their forecasts to reflect the passage of time with no fatal accident to that point. In October 2019, the AV Index dropped to -0.57 as the crowd shifted their projections from bullish to bearish regarding the number of AV-related accidents reported in California during 2019. This was driven because there were abnormally large increases in accidents.